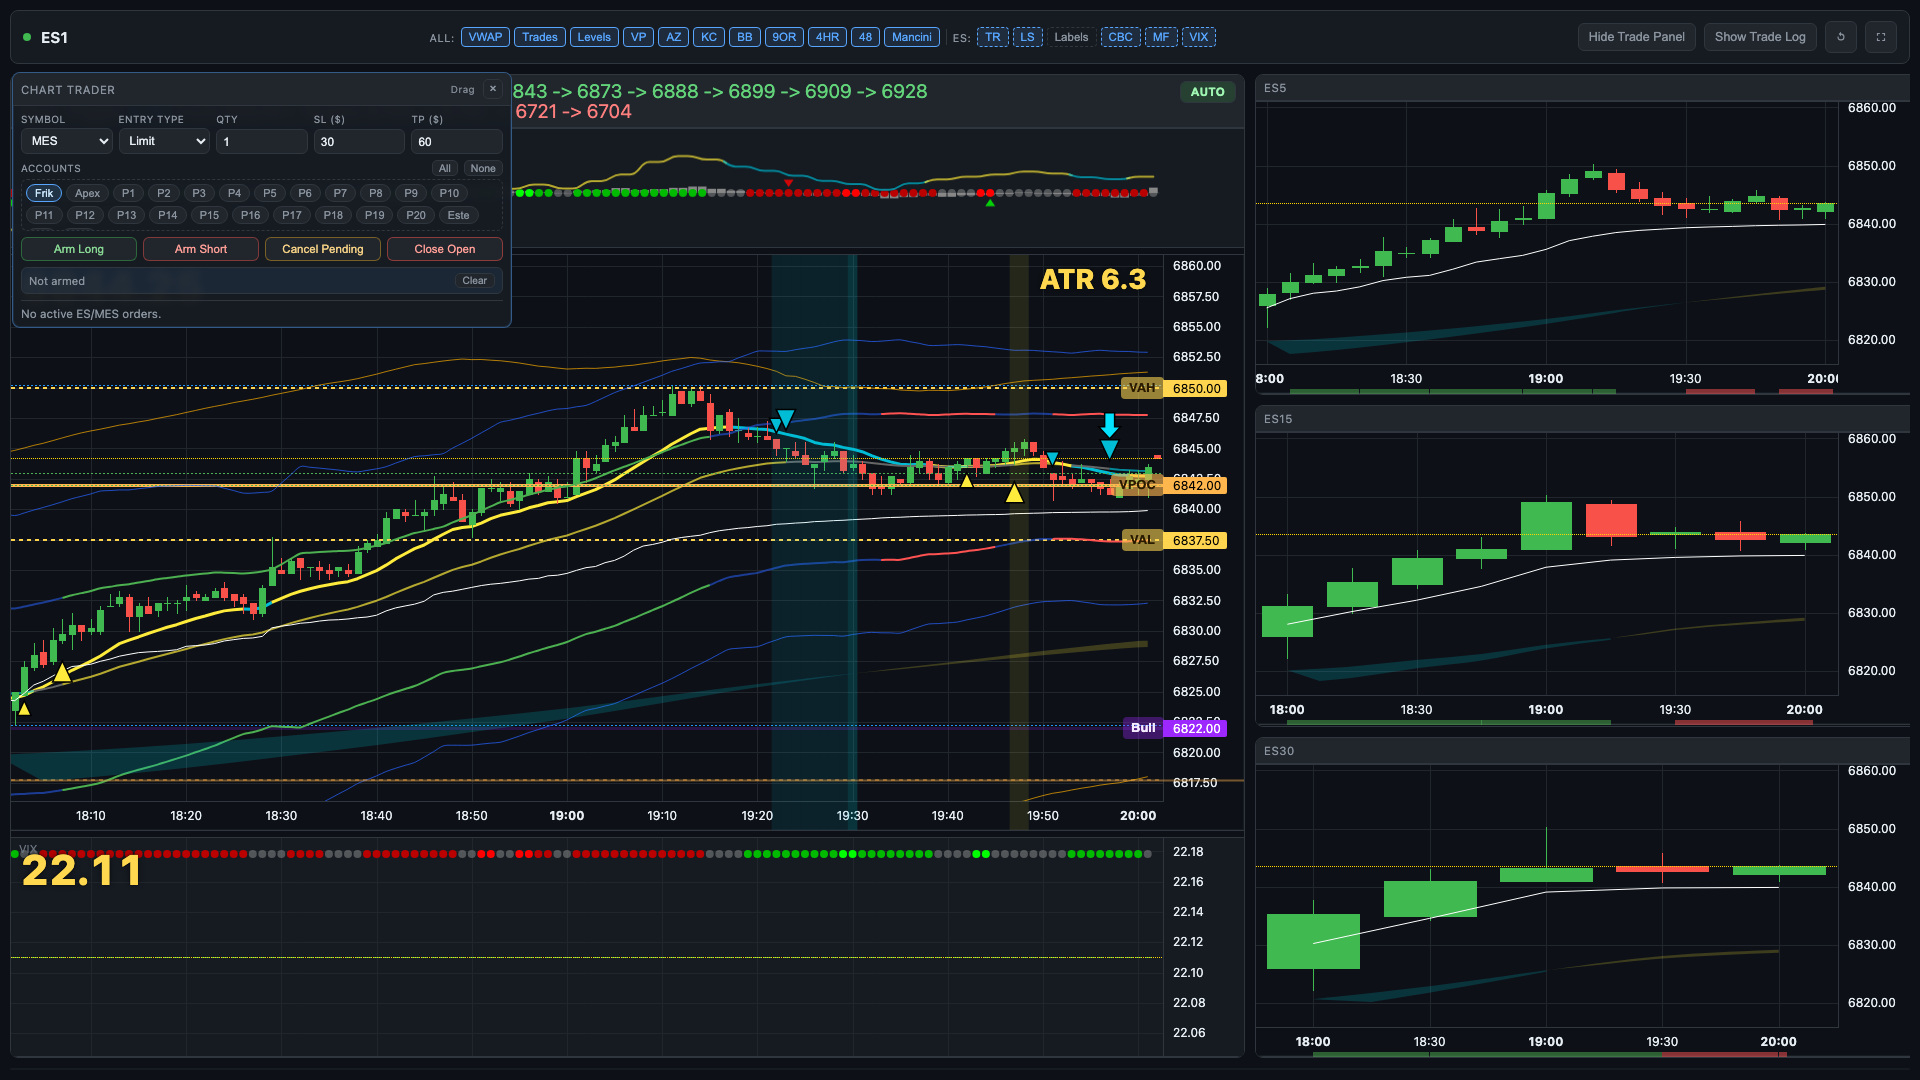
Core stack on every supported chart root
These are the default layers for structure, location, and session awareness across the live chart.
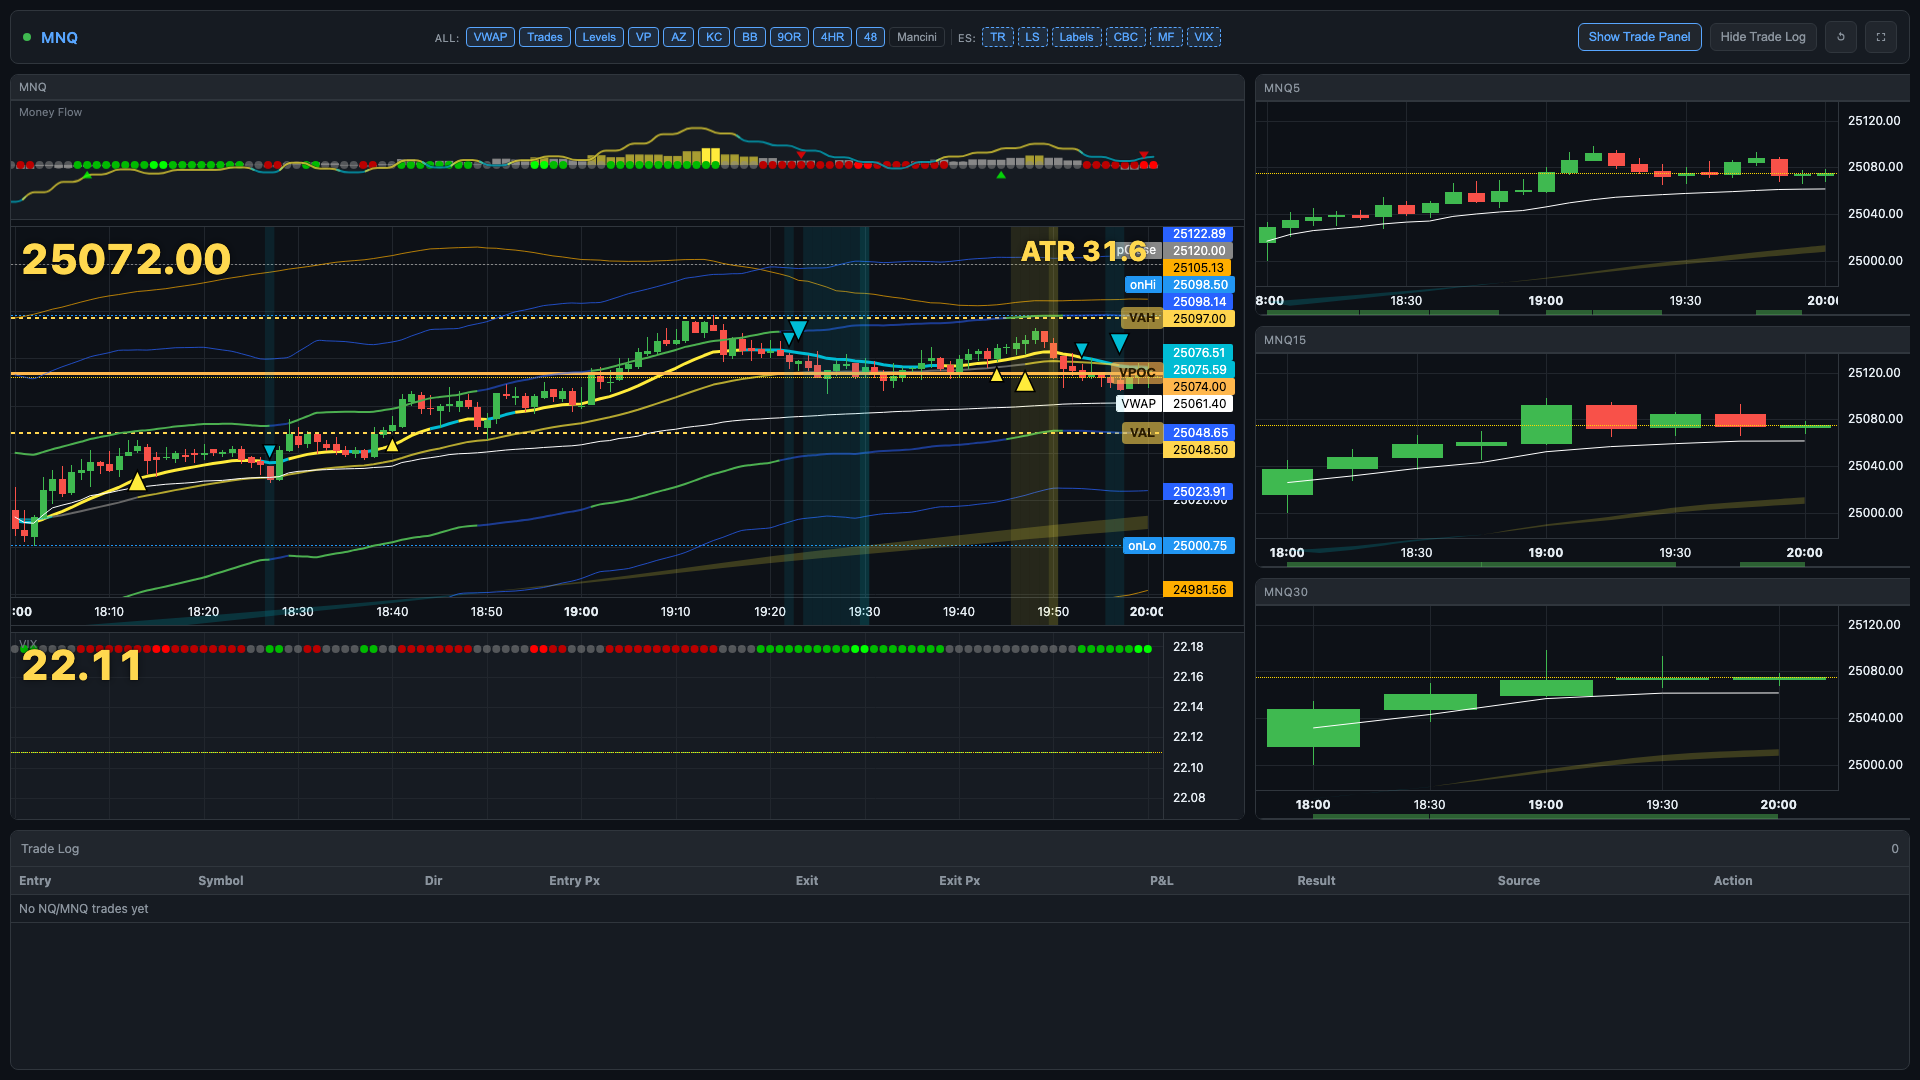
Switch between MES, MNQ, and MGC and the chart keeps the same visual workflow for execution.
Real chart controls. Real overlays. Real execution in one window.
Open /portal/chart.html and trade from the same screen where TradingPlace Indicators live.
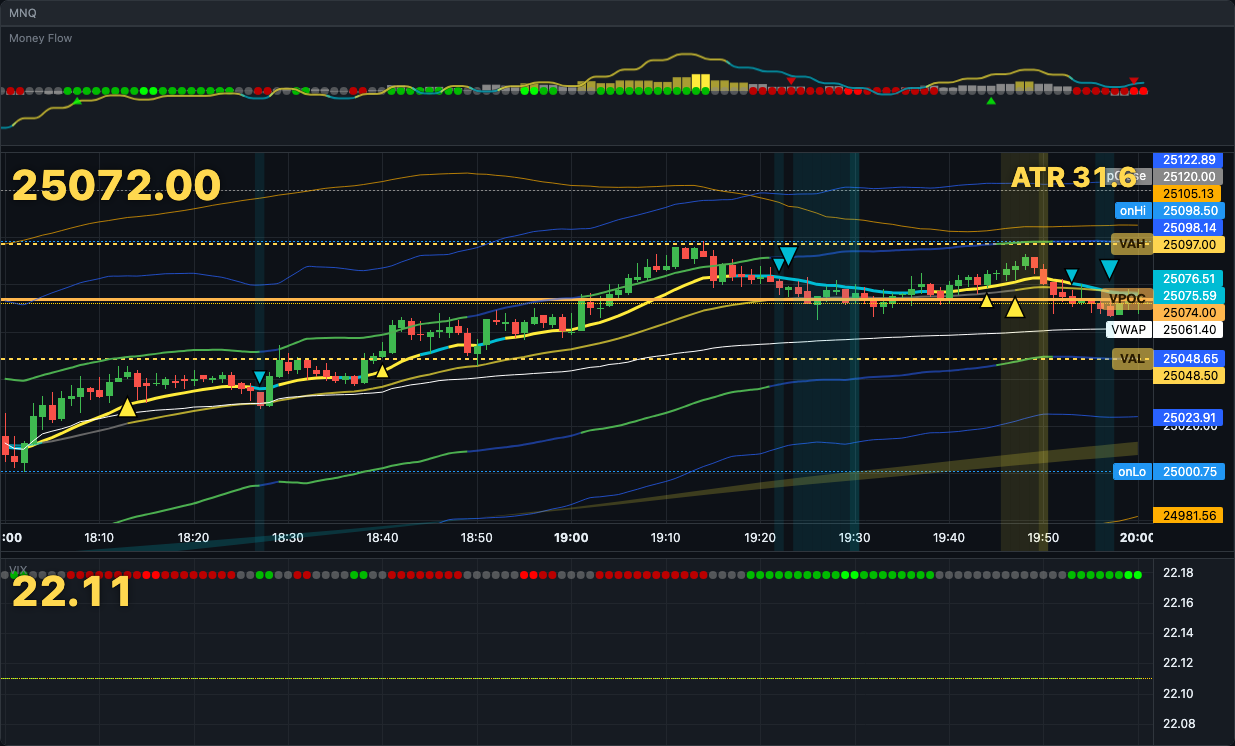
Core layers like VWAP, Trades, Levels, Alpha Zone, Keltner, Bollinger, 9OR, 4HR, and 48 stay visible
while the chart trader lets you enter, move risk, and manage open positions without leaving price.

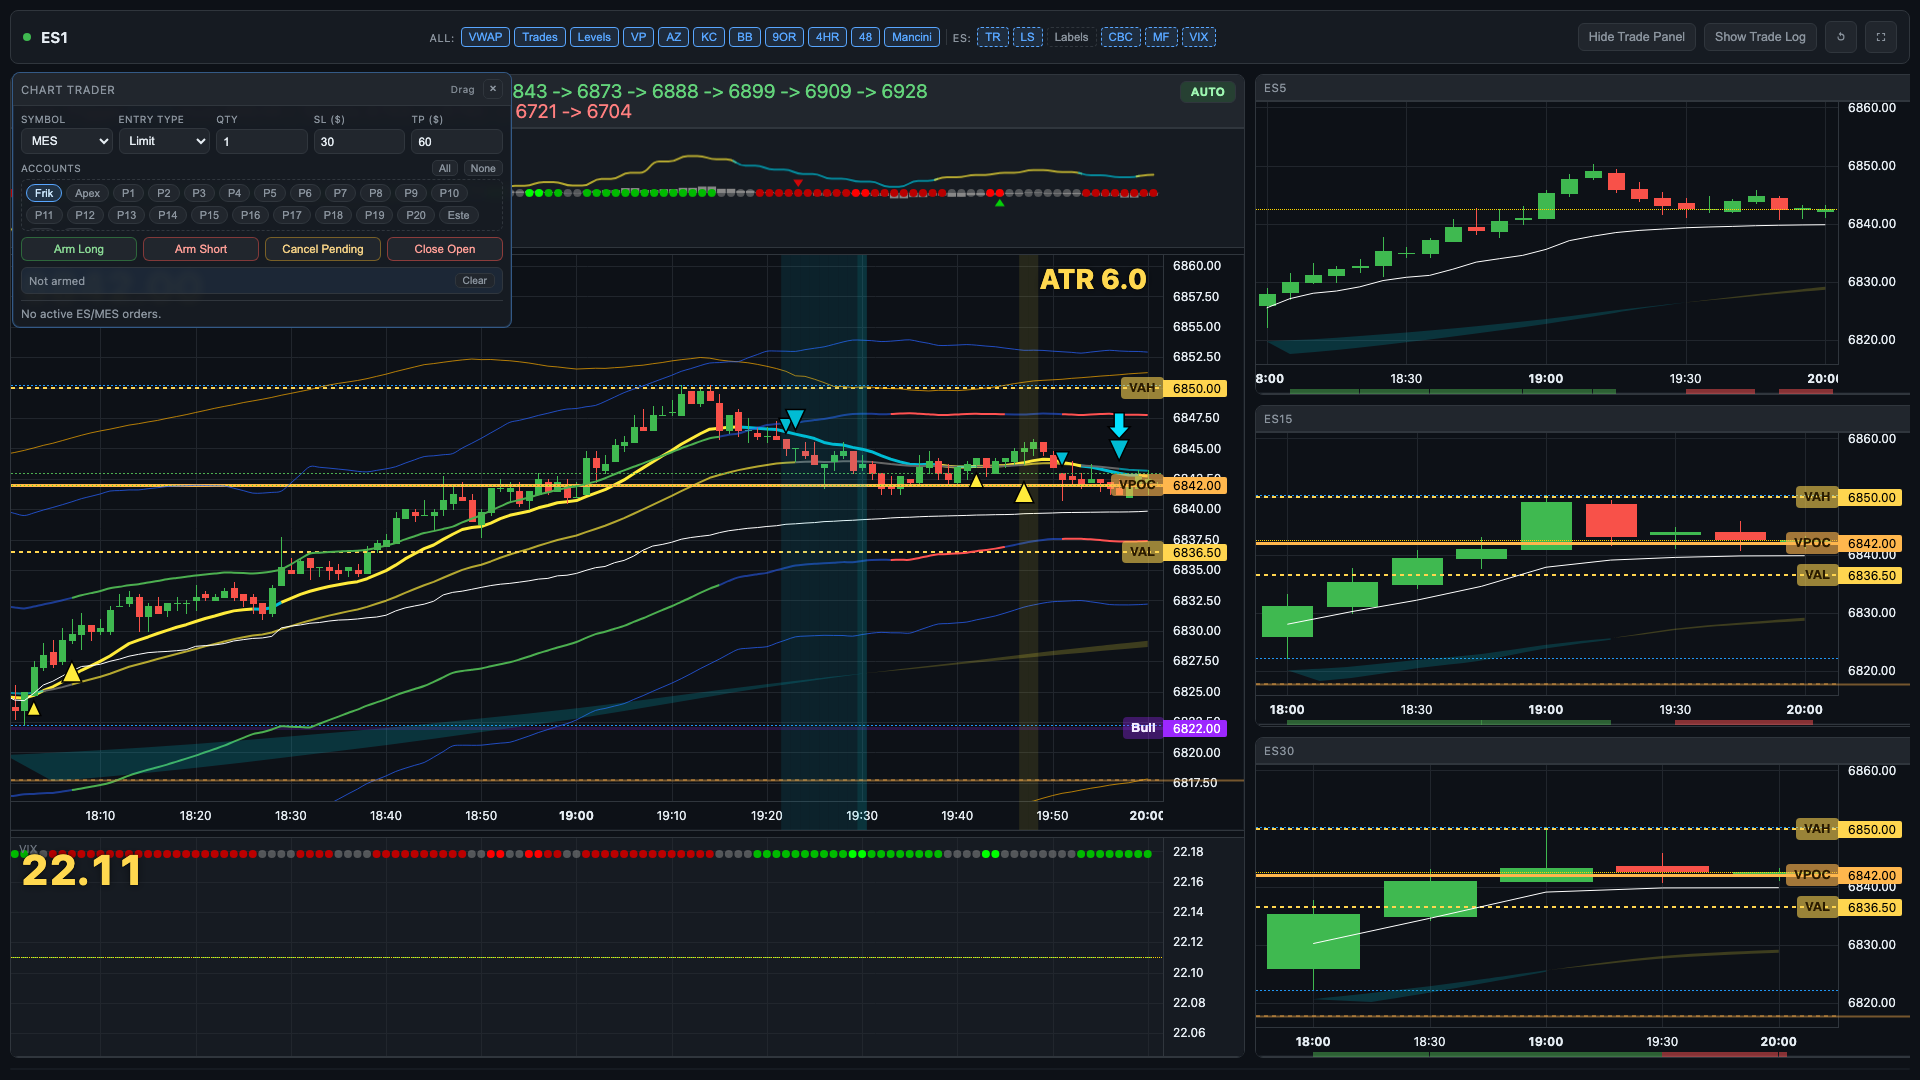
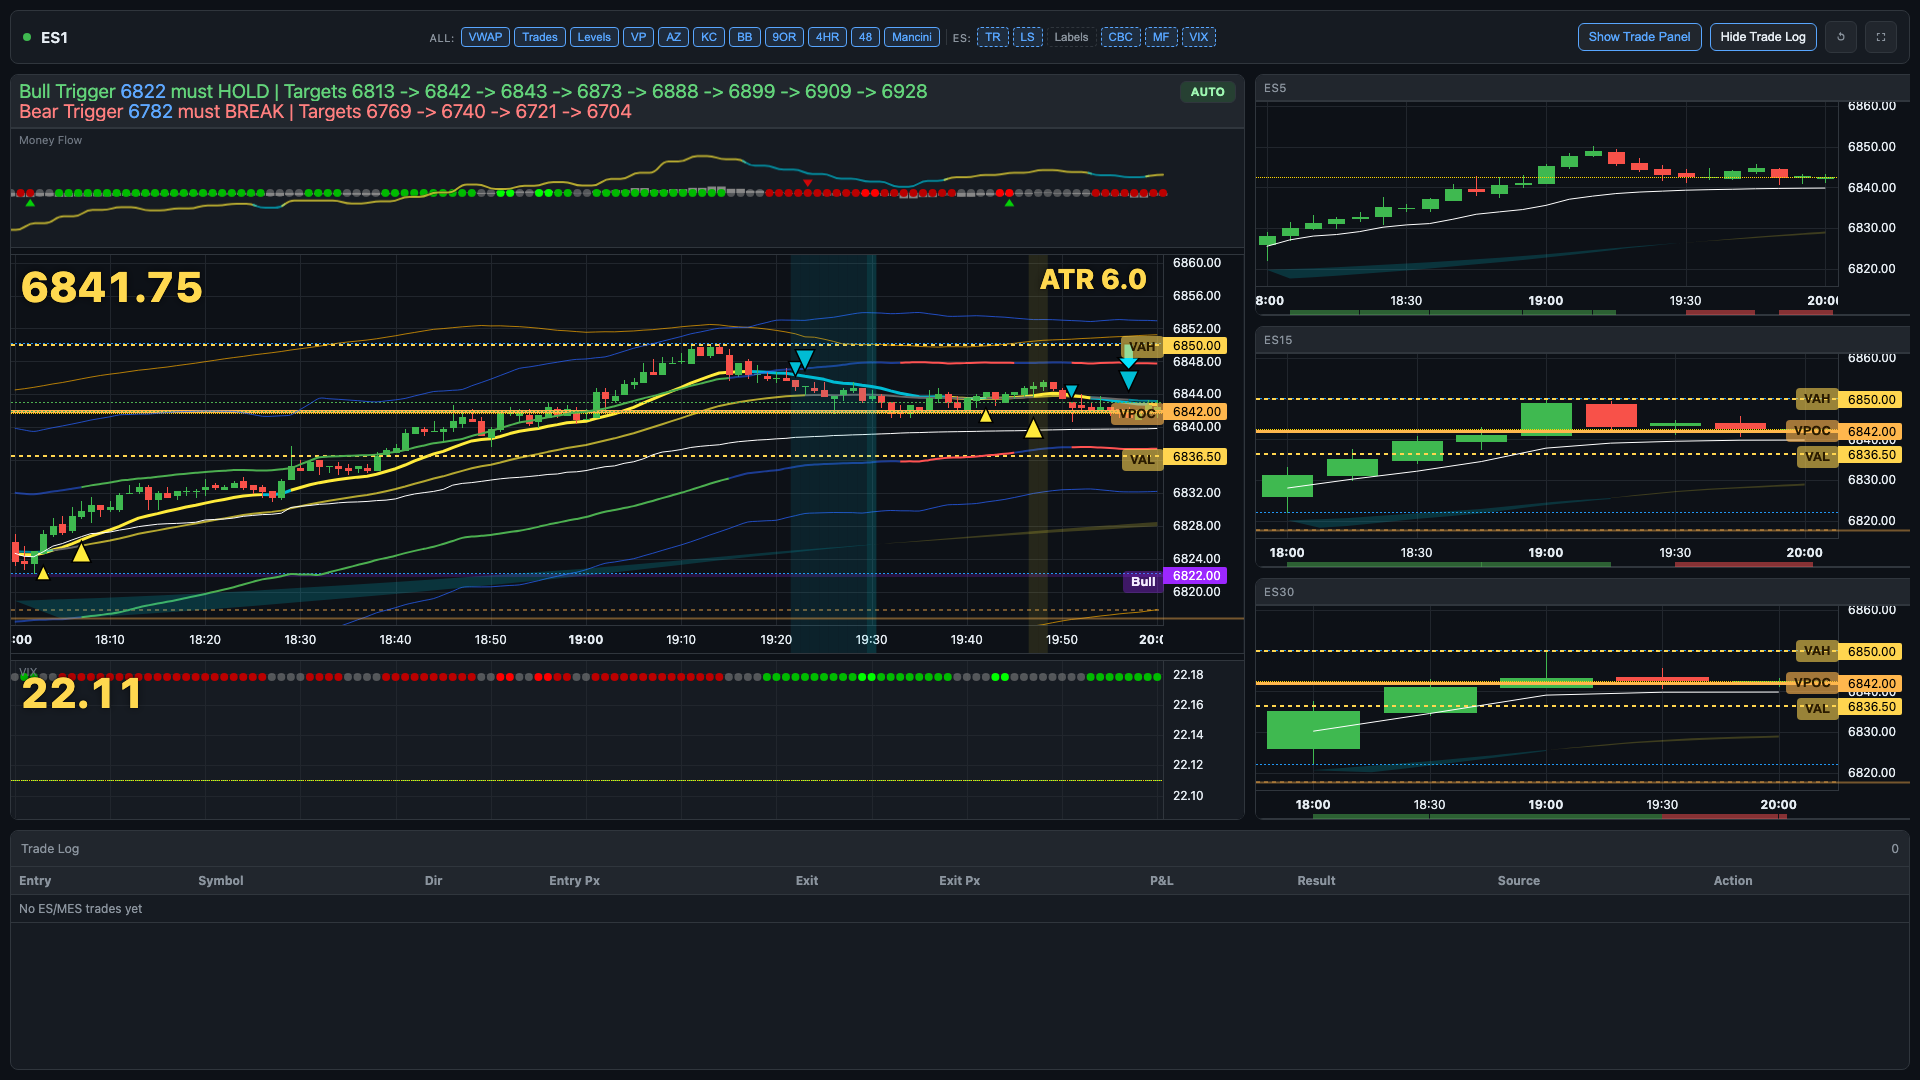
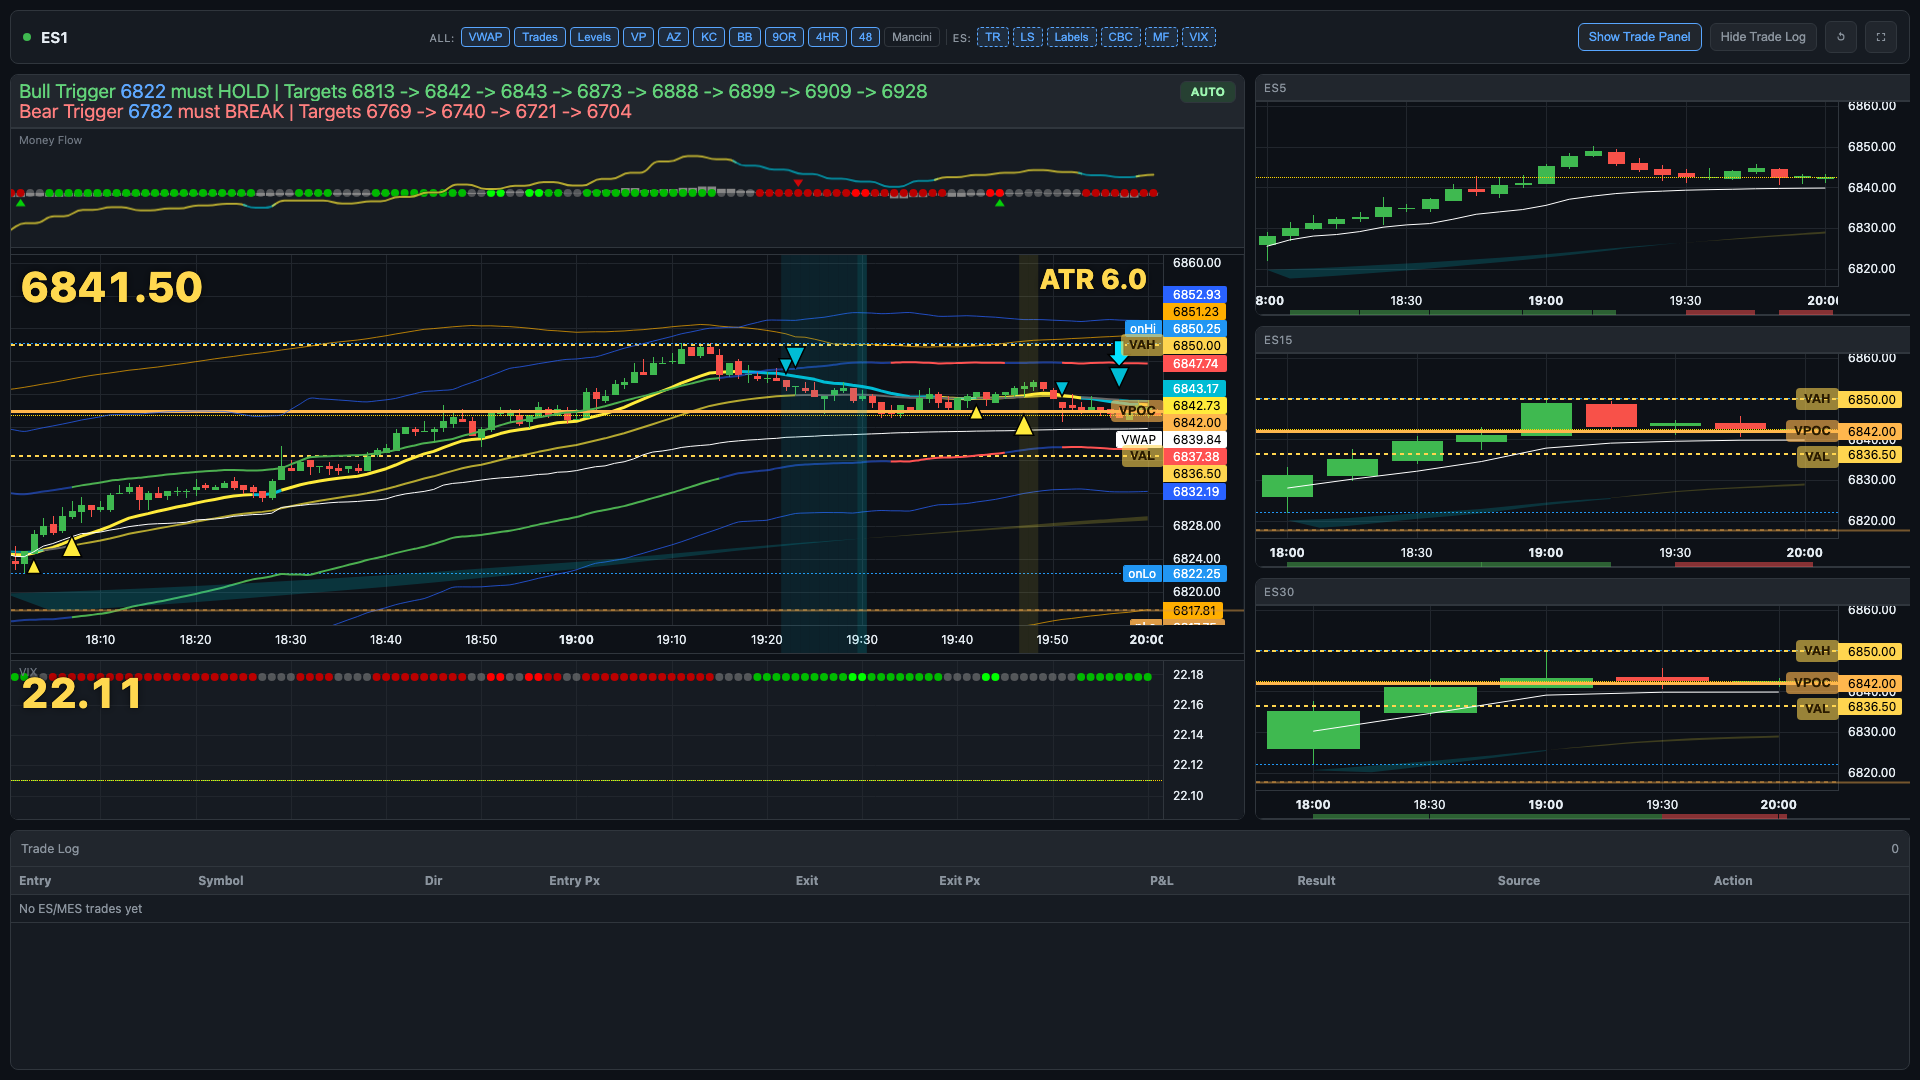
Real header controls from /portal/chart.html above the live noon chart capture.
Explore the same chart controls traders use in the portal. Shared layers stay consistent across supported chart roots, and MES unlocks the full ES-family bias stack.
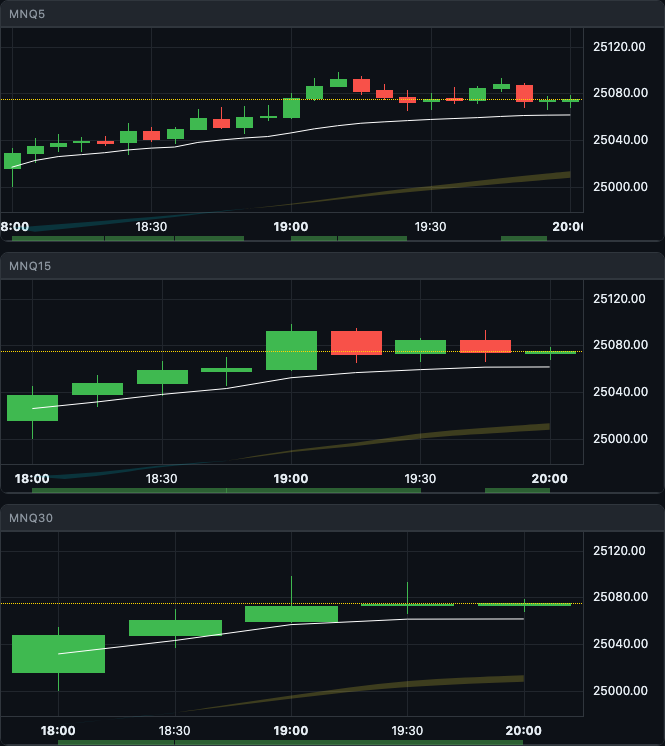
The portal chart keeps the indicator toggles in the header, the execution chart on the left, and the 5m / 15m / 30m context stack on the right.
These are the default layers for structure, location, and session awareness across the live chart.
Switch between MES, MNQ, and MGC and the chart keeps the same visual workflow for execution.
When the live chart root is MES, the header enables the extra tools traders use for pressure, bias, and labeled level reads.
Those MES-only toggles are the same controls exposed in the live chart header, not generic marketing labels.
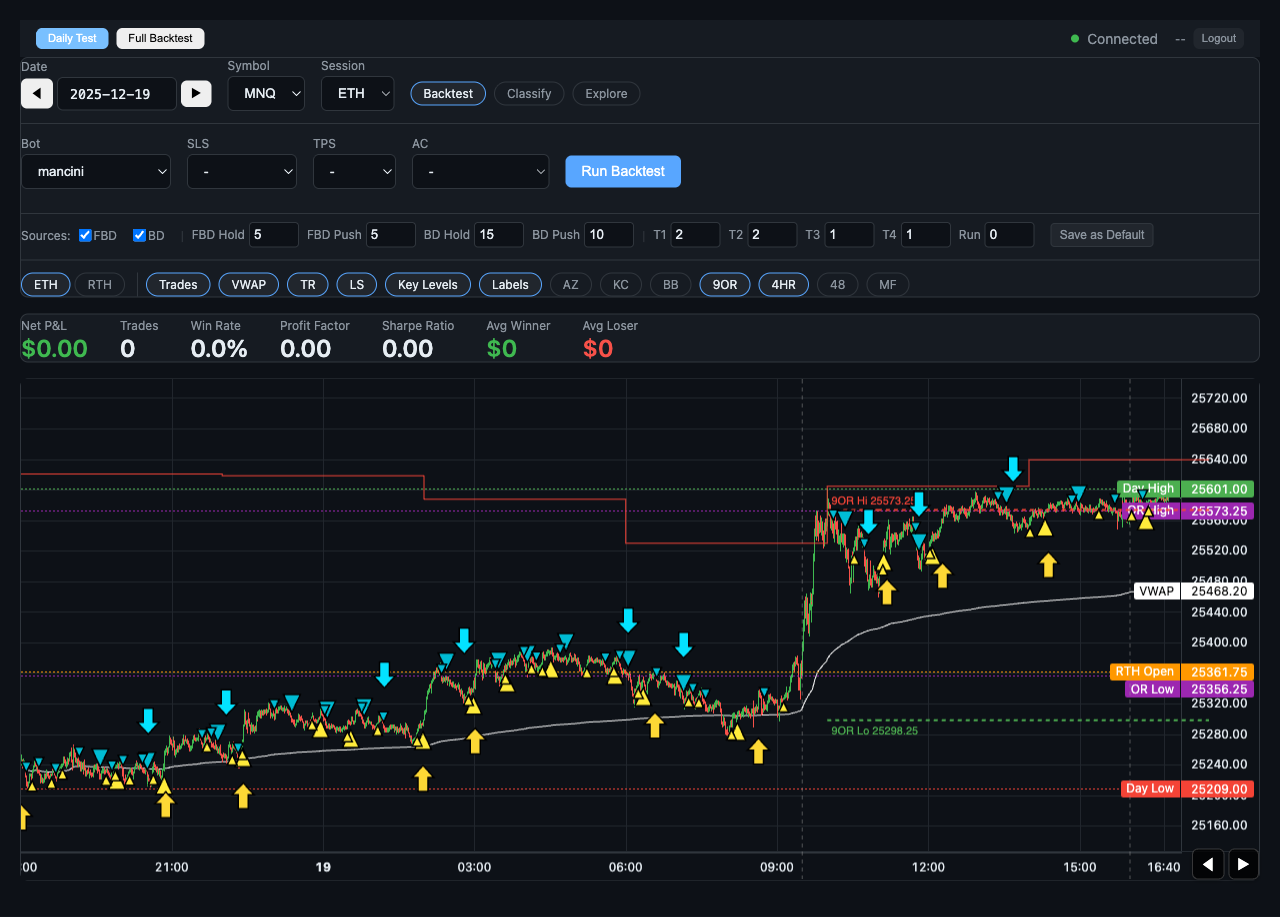
Switching the chart to RTH while the market is active gives you stronger structure, cleaner rotations, and more obvious reaction zones than the extended session drift. For live trading, RTH scope is the recommended default during regular hours.
This audio walk-through breaks down the Mancini FBD, or Failed Breakdown, as a smart-money liquidity trap. Use it when you want the context behind the reclaim, acceptance, and entry instead of looking at levels alone.
The lesson covers how the failed breakdown works as a trap, why the reclaim matters more than the first break, and how to stay patient until price proves acceptance back above the level.
Live chart states captured from /portal/chart.html showing the real header controls, execution chart, right-column context panels, and chart trader states.
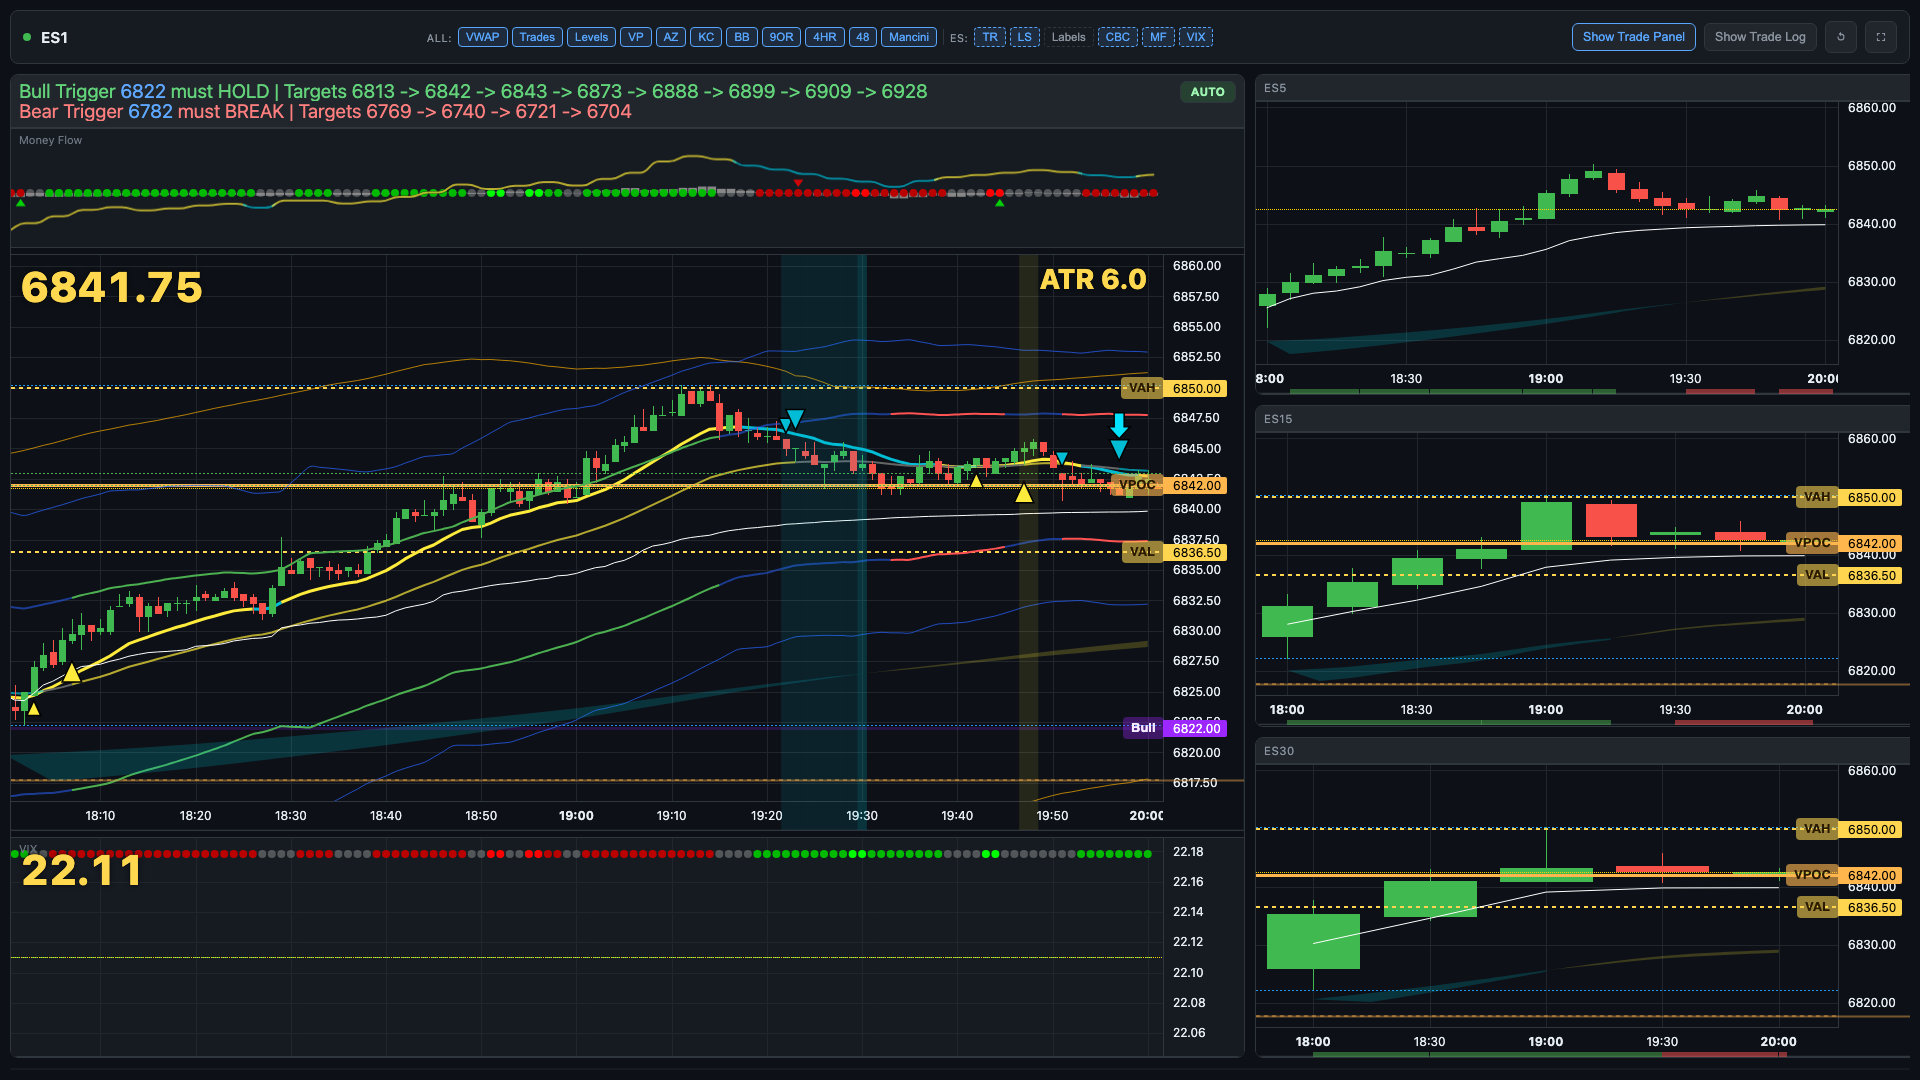
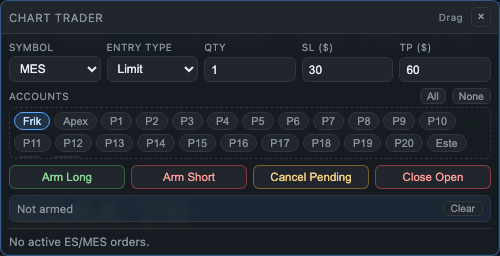
Keep the indicator read, the order entry, and the trade management path inside one continuous loop.
Open /portal/chart.html, choose your chart root, switch RTH or extended session, and start from the default TradingPlace indicator layout.
Use VWAP, levels, AZ, KC, BB, 9OR, 4HR, and 48 to frame the trade, then use the MES-only extras when you want deeper ES-family context.
Adjust stop and target, hide or reopen panels, and review trade history while the live chart stays front and center.
Most traders use a separate charting tool and a broker platform simultaneously. The context switch is where execution timing breaks down.
/portal/chart.html. You can see the full feature breakdown on the pricing page.
/portal/chart.html after signing in. You can also open it in a dedicated browser window or second monitor for a focused trading surface separate from your main cockpit session.
Platinum unlocks live chart trading with TradingPlace Indicators and on-chart execution. Open the chart, read the same overlay stack you trade from, and manage risk without splitting charting and execution into two apps.
Platinum plan feature. Trade live against your connected accounts from a dedicated chart surface.